🍽️ Zomato Restaurant Analytics Dashboard (Power BI)
View on GitHub📋 Overview
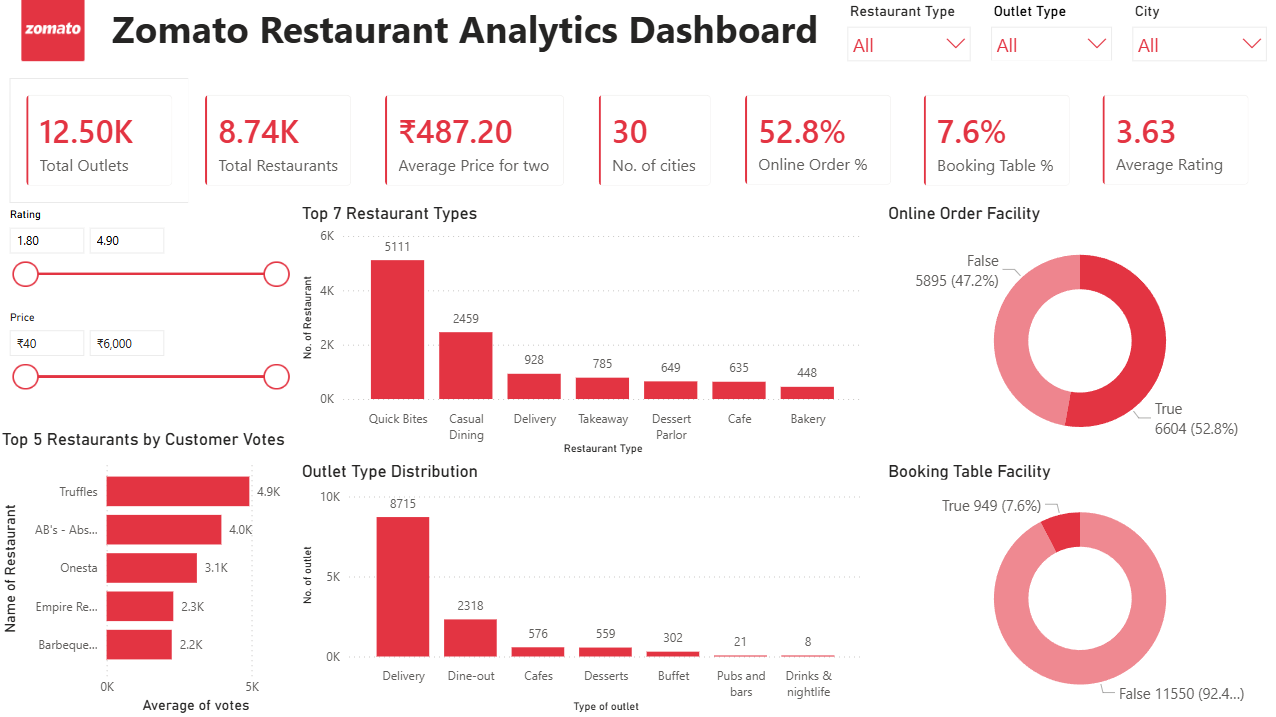
This project presents an interactive Power BI dashboard analyzing restaurant market trends using Zomato restaurant data.
The original dataset contained 56,251 restaurant records, which were cleaned, transformed, and deduplicated into 12,500 unique outlet records for meaningful business analysis.
The dashboard provides insights into customer ordering behavior, outlet distribution, pricing trends, restaurant segmentation, and restaurant chain performance through interactive visual storytelling.
✨ Key Insights
📦 Outlet Distribution Analysis
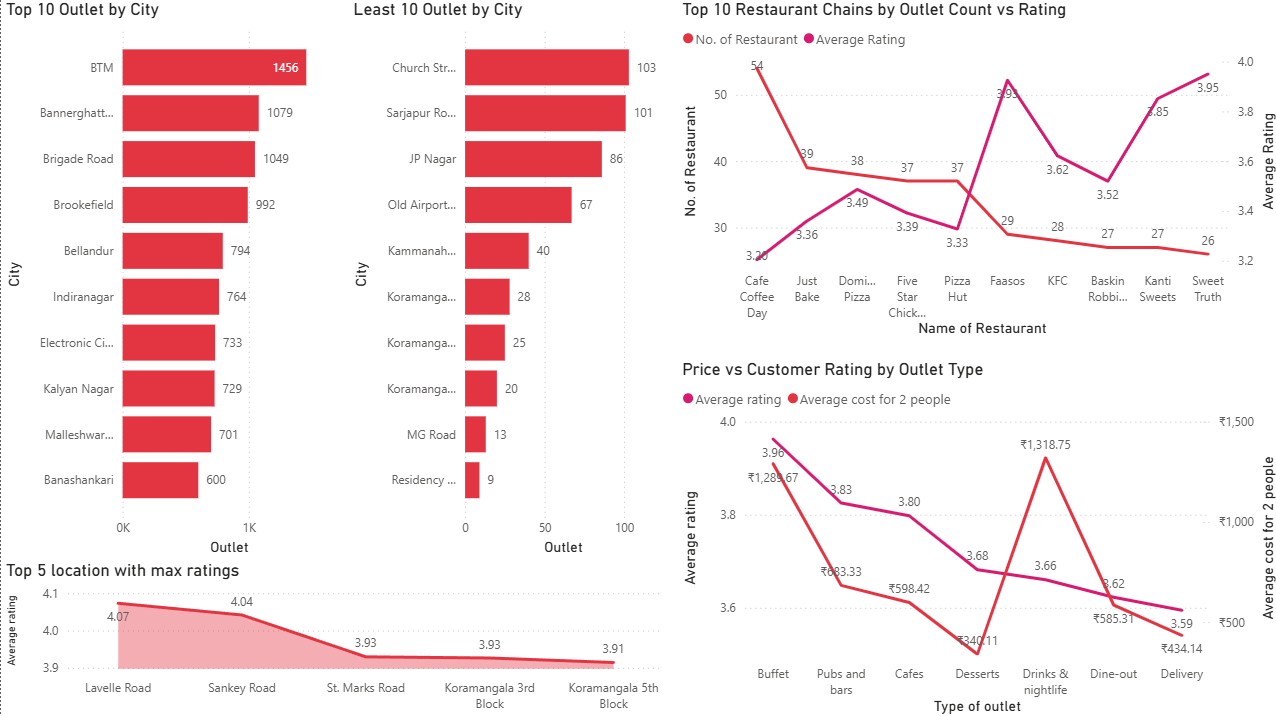
- Analyzed outlet concentration across cities and restaurant clusters
- Identified high-density and low-density restaurant markets
🍔 Restaurant Segmentation
- Compared restaurant types such as Quick Bites, Cafes, Delivery, and Casual Dining
- Identified dominant outlet business models
🛒 Customer Ordering Behavior
- Measured online ordering adoption and table booking availability
- Tracked customer convenience behavior across restaurants
💰 Pricing & Rating Analysis
- Compared pricing patterns against customer ratings
- Identified premium outlet performance trends
🏢 Restaurant Chain Performance
- Analyzed top restaurant chains by outlet presence and ratings
- Compared brand scale versus customer satisfaction
🧹 Data Cleaning & Transformation
- Processed 56K+ raw records and reduced them to 12.5K unique outlets
- Removed duplicates using restaurant name and address logic